New Results From Satellite Data On Global Warming
When asked about global warming, Ted Cruz answered citing deniers favorite satellite data, RSS, claiming no increase in atmospheric temperatures in the last 18 years. As noted by SkepticalScience,
Since that time though, the RSS data, an outlier in global temperature measurement, has been corrected,
This shows a clear upward trend to 2003, a halt in the trend for 6 years and then a renewed trend from 2009 onward. I fit a linear trend to the portion of the data from 2009 to January 2016,

The slope of this line is 0.999103. This translates to a decadal increase in atmospheric global temperature of 1.1456969 °C. The January 2016 temperature is .83 °C, but most of this is due to the El Nino. A more reasonable forecast should start with the fitted temperature of about .35 °C. The slope measured by my analysis is also influenced by the El Nino, and therefore 1 °C per decade is probably more reasonable. Putting this together means we're going to hit the goal we're hoping to stay under, 2 °C, by around 2031.
At the Paris Conference
Global warming deniers have been touting the RSS data, claiming to show a failure of the global temperatures from increasing over the last 18 years. Here is the corrected data set to the linear trend

Even with the strong linear assumption the trend is increasing. The global warming deniers no longer have a leg to stand on. The decadal slope is 0.287058 which implies 2 °C by 2074, a bit more space to get the greenhouse gases under control.
RSS had the only data that could remotely support Senator Cruz’s argument. Surface and ocean temperatures have warmed, ice has melted, sea levels have risen, species have been forced to migrate, spring has begun earlier, and so on.
Even other estimates of the atmospheric temperature, of the same satellite data by scientists at the University of Alabama at Huntsville (UAH), and by weather balloons, indicate that the atmosphere is warming. Ted Cruz cherry picked RSS because it was the lone outlier that seemed to support his preferred argument against the need to take action to mitigate the risks posed by human-caused global warming.I commented on the RSS data a year ago. I used a type of analysis developed in economics, LOESS, or locally reweighted regression, which relaxes the linear assumption. The linear assumption is a very strong one ruling out any local variations in the underlying trend. My analysis revealed that
a clear increase in temperatures from about the middle of 2009 on. Temperatures were increasing from 1997 to somewhere in the middle 2004, and then decreasing from there until somewhere in 2009.
Since that time though, the RSS data, an outlier in global temperature measurement, has been corrected,
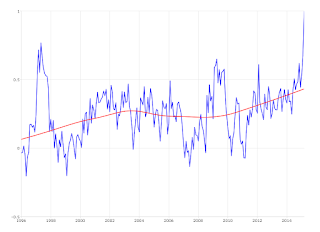
In [a] new paper, Mears and Wentz detail the revised RSS method to account for drift in the time of day at which satellites measure the same location on Earth (known as “diurnal drift”, discussed by Mears at the 0:47 mark in the above video). They applied a method suggested by Stephen Po-Chedley and colleagues at the University of Washington in an important paper covered by John Abraham last year. As a result, the new version of RSS (v4.0) shows about 60% more warming than the previous version (v3.3) since the record began in 1979.I updated my previous analysis with the new RSS data. The results are striking. Here is a plot of the fit of the LOESS model,

This shows a clear upward trend to 2003, a halt in the trend for 6 years and then a renewed trend from 2009 onward. I fit a linear trend to the portion of the data from 2009 to January 2016,

The slope of this line is 0.999103. This translates to a decadal increase in atmospheric global temperature of 1.1456969 °C. The January 2016 temperature is .83 °C, but most of this is due to the El Nino. A more reasonable forecast should start with the fitted temperature of about .35 °C. The slope measured by my analysis is also influenced by the El Nino, and therefore 1 °C per decade is probably more reasonable. Putting this together means we're going to hit the goal we're hoping to stay under, 2 °C, by around 2031.
At the Paris Conference
According to the organizing committee at the outset of the talks,[6] the expected key result was an agreement to set a goal of limiting global warming to less than 2 degrees Celsius (°C) compared to pre-industrial levels.
In the adopted version of the Paris Agreement,[3] the parties will also "pursue efforts to" limit the temperature increase to 1.5 °C. The 1.5 °C goal will require zero emissions sometime between 2030 and 2050, according to some scientistsAccording to my analysis we'll reach 1.5 °C around 2026, a bit sooner.
Global warming deniers have been touting the RSS data, claiming to show a failure of the global temperatures from increasing over the last 18 years. Here is the corrected data set to the linear trend

Even with the strong linear assumption the trend is increasing. The global warming deniers no longer have a leg to stand on. The decadal slope is 0.287058 which implies 2 °C by 2074, a bit more space to get the greenhouse gases under control.


Comments
Post a Comment