Global Warming is Human Caused
A new study shows that global warming is 97% anthropogenic, i.e., due to human activities.
This diagram is not from the study, but illustrates the point it makes:
The study considered temperature changes for the period of 1951–2010. During that time, global surface temperatures warmed about 0.65°C. During that same period, their statistical approach which combines observations and climate models outputs found that humans have caused 0.67 ± 0.12°C warming, while natural factors have had essentially no effect on global temperatures (-0.01 ± 0.02°C).
This diagram is not from the study, but illustrates the point it makes:
 |
| Five datasets of global surface temperature and lower troposphere temperature are shown in this animation before and after removing the short-term effects of the El Niño Southern Oscillation (ENSO), solar variability, and volcanic aerosols. A 12-month running average was applied to each dataset. Foster and Rahmstorf (2011) used multiple linear regression to determine and then statistically filter out these short-term effects to reveal the steady underlying trend of primarily human-caused global surface warming. This method effectively removes the short-term noise that can complicate the interpretation of temperature trends or permit "cherry picking" of graph endpoints or short time periods to find periods that erroneously suggest global warming has paused rather than continued unabated as these results show. |
This diagram is from the study:
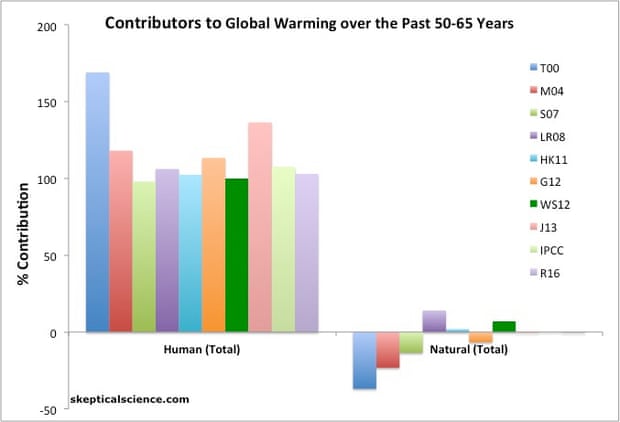 |
| The percentage contribution to global warming over the past 50-65 years in two categories: human causes (left) and natural causes (right), from various peer-reviewed studies. The studies are Tett et al. 2000 (T00, dark blue), Meehl et al. 2004 (M04, red), Stone et al. 2007 (S07, green), Lean and Rind 2008 (LR08, purple), Huber and Knutti 2011 (HK11, light blue), Gillett et al. 2012 (G12, orange), Wigley and Santer 2012 (WG12, dark green), Jones et al. 2013 (J13, pink), IPCC AR5 (IPCC, light green), and Ribes et al. 2016 (R16, light purple). The numbers are best estimates from each study. Illustration: Dana Nuccitelli |
Bottom line, humans are fouling their nest. The future looks grim and we can only blame ourselves (or at least the Republicans who keep us from trying to solve the problem).


Comments
Post a Comment