Arctic Ice -- the global warming "canary"
In a previous post, I discussed how deniers were using the Arctic Ice extent as evidence against global warming. They were taking an uptick in 2013 and 2014 as an indication that warming has stopped.

As I pointed out in that post an uptick is not evidence. Anyone with familiarity with time series
knows that an uptick isn't enough to go on. In finance, a trader might have a short position in a stock that looks like that. They have to decide whether their short position is going wrong on them and that they might be forced to cover their short position. But no trader I know would jump to that conclusion on that evidence. So why are deniers jumping to the equivalent conclusion that Arctic sea ice is reversing? I believe because of an emotional belief, and I can tell you such emotional beliefs are fatal in finance. Someone who took something like that as evidence of a reversal in a trend would soon find themselves bankrupt.
In fact, the trend has not reversed. The trend in 2015 is unmistakable as shown here.
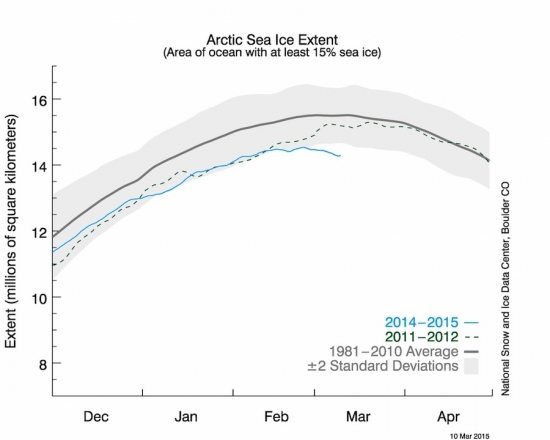
That blue line shows the sea ice extent plunging far past any recorded extent. Summer isn't here yet but the trend is showing a disturbing drop.
It’s official: When the sea ice that blankets the Arctic Ocean hit its yearly peak on Feb. 25, the maximum area was a record low.
And Arctic warming has side effects, a "polar vortex".


Comments
Post a Comment